One household reads a number on a sales page and expects exactly that number to appear on a speed test. Another reads the same number and expects roughly half of it at eight in the evening. The second household is disappointed far less often.
Knowing where the gap between advertised and delivered speed comes from turns a mystery into a set of ordinary causes, most of which can be measured.
1. What the advertised figure legally represents
Regulators generally require an advertised speed to be achievable by a stated proportion of customers, measured at peak hours. That proportion is often fifty percent, so the advertised figure is a median rather than a floor.
Half of subscribers therefore sit below the headline figure, and a household experiencing less than the advertised speed is in normal company rather than experiencing a fault.
2. Distance and line quality on copper
Copper connections lose speed with distance from the cabinet, and the loss is steep. A neighbour two streets away can receive a materially different speed from the same package on the same network.
Line quality adds a second variable: joints, age and interference all reduce the achievable rate. Two properties at identical distances can be separated by a wide margin simply because one has a cleaner path.
3. Contention and shared capacity
Consumer connections share capacity with neighbours, and sharing ratios determine how much of the headline speed survives at busy times. The ratio is rarely published, though it shapes evening performance more than any other factor.
Where contention is high, the line performs well at noon and poorly at nine. That pattern is characteristic and easy to recognise once a few measurements are taken at different hours.
4. The equipment inside the home
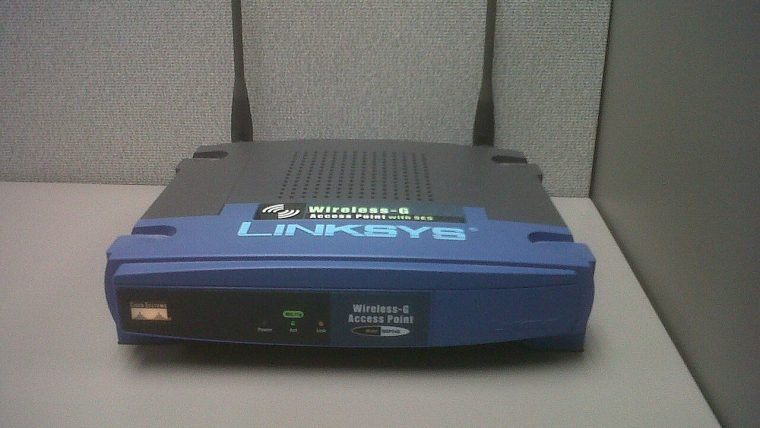
The router, the Wi-Fi band and the distance to the device all reduce the speed a test reports, and none of them involve the provider’s network. Testing over Wi-Fi measures the home network more than the connection.
Wired testing from a suitable device gives the connection’s real ceiling. The difference between wired and wireless results is the home network’s contribution, expressed as a number.
5. The testing device as a bottleneck
An older laptop, a phone on a busy Wi-Fi band or a browser running several tabs can cap a result well below the line speed. A device with a limited network adapter reports its own limitation.
Using a modern device with a wired connection removes most of this uncertainty. Where two devices produce very different results on the same line, the device is usually the variable.
6. Server distance and test methodology
Speed tests measure the path to a specific server, and that path is not the same as the path to the services actually used. A test server across the country reports a lower figure than one nearby, without either being wrong.
Testing against several servers and taking the best result gives a fairer view of capacity, while the worst result reflects a real-world case that some applications will experience.
7. Time of day and the peak profile
Evening performance in most networks is the lowest of the day, which is precisely when households measure. A test at eleven in the morning says little about the connection’s behaviour when the family is streaming.
Measuring at several times, including peak, produces a profile rather than a number. The profile is what describes the connection; the single number is what describes a moment.
8. Wi-Fi band and channel choices
The 2.4 GHz band travels further and carries less data, while the 5 GHz band does the opposite. Devices often cling to the slower band because its signal is stronger at the far end of the house.
Checking which band a device is using explains many results that look like provider faults. Splitting the bands into separate network names gives control over which one a device chooses.
9. Building construction and interference
Solid walls, foil-backed insulation and metalwork attenuate Wi-Fi sharply, and neighbouring networks add interference on the same channels. Both effects are local and neither is the provider’s responsibility.
Mapping coverage room by room shows where the signal collapses. That map usually identifies the one or two locations where an additional access point would fix everything.
10. When the gap is a genuine fault
A wired test well below the package’s stated minimum, repeated at quiet times and on more than one device, is worth reporting. The evidence matters more than the complaint.
Providers respond differently when presented with a sequence of dated results. Several measurements at different hours are considerably more persuasive than a single disappointing figure.
11. Making the guarantee do its job
Where a speed guarantee exists, it usually requires the household to demonstrate a wired shortfall across multiple tests. Meeting those conditions is what converts the guarantee into a credit.
The conditions are published and short. Reading them before opening a case is the difference between a credit and a support conversation that ends without one.
12. What can realistically be improved
Inside the home, a cable run, a better router or a mesh node often recovers a large share of the missing speed. Outside it, the achievable ceiling is fixed by the network serving the street.
Separating the two is the useful part of the exercise. Households frequently spend money on provider changes when the constraint was a router in a cupboard under the stairs.
13. Recording a baseline worth keeping
Wired and wireless results, at three times of day, on two devices, dated and stored somewhere findable. Five measurements that take twenty minutes and last for the life of the contract.
With a baseline in hand, every later question gets easier, including whether a change was a fault or simply a Tuesday evening on a shared network.
14. Why the gap is asymmetric between download and upload
Upload shortfalls exceed download shortfalls on most consumer technologies because upstream capacity is shared more thinly and provisioned with less headroom. A line that loses twenty percent downstream may lose half its upstream at peak.
This is why households that notice a problem usually notice it first in calls and backups rather than in streaming.
15. What the gap means for a contract’s promises
Where a guarantee is expressed as a minimum speed, it usually applies at peak and is measured over a wire. Meeting that condition is the household’s responsibility, and the measurements must be taken accordingly.
Understanding the conditions in advance is what allows the guarantee to be used when it is needed.
16. A short list of causes worth checking in order
Wired result first, then device capability, then server choice, then time of day, then background traffic, then Wi-Fi. Working through them in that order identifies the cause in a few minutes.
Reversing the order, which is the natural instinct, is what produces the impression that the provider is at fault.
17. How a package’s minimum speed is calculated
Minimum speed commitments are usually derived from measurements across the customer base rather than from the technical capability of the line. They are a statistical floor rather than a physical guarantee.
Understanding the derivation explains why a household can fall below the floor and still be within the terms of the commitment.
18. Presenting a case that a provider can act on
Wired results, dated, at peak, repeated across several days, with the device and the server noted, meet the conditions most guarantees require. Supplying them in that form moves a case forward immediately.
Supplying a screenshot without context achieves the opposite, which is the most common reason guarantee claims fail.
Advertised speeds describe a network and delivered speeds describe a property. The gap between them is made of ordinary, measurable parts, and none of those parts is a secret.

Nicholas Burnham
Tests household broadband packages and writes up what the small print actually costs. Everything here is measured or sourced, never taken from a press release.